Clara Deser, National Center for Atmospheric Research
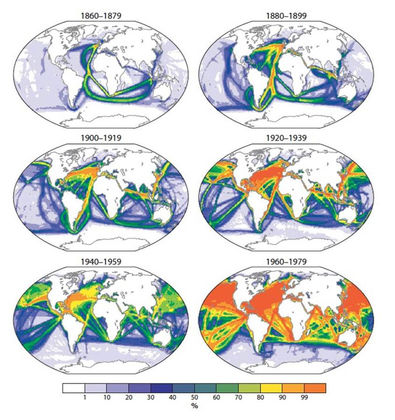
Figure 4. Distribution of sea surface temperature observations from the International Comprehensive Ocean Atmosphere Data Set for each 20-year period from 1860 to 1979. This dataset underpins the NOAA ERRST long-term reanalysis discussed above. Color shading indicates the percentage of months that have at least one measurement within a 2°-latitude by 2°-longitude grid box (roughly 140 by 140 miles near the equator). Image credit: Used with permission from Sea Surface Temperature Variability: Patterns and Mechanisms, Annual Review of Marine Science 2009, doi: 10.1146/annurev-marine-120408-151453, courtesy Clara Deser, National Center for Atmospheric Research.