ClassifiedsDirectoryPhotosStoreAboutContactAdvertise
Free TrialSubscribeSign In
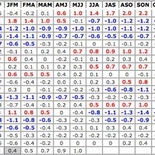
NOAA Climate Prediction Center
Figure 3. Departures from seasonal average for sea-surface temperatures (SSTs) across the Niño3.4 region over three-month intervals from 1997 to 2015. The shaded box (Jan-Mar 2015), originally 0.5°C, was demoted to 0.4°C with a July upgrade to SST analysis techniques. Image credit: NOAA Climate Prediction Center.