

By Don McDowell
AZBW Salt Water Fishing Editor and Host Of Shake Rattle and Troll Radio
El Niño Is 'Significant And Strengthening
August 1, 2015
Don McDowell - "Shake, Rattle & Troll" Radio
El Niño is 'significant and strengthening,' could rival strongest on record even the Super El Niño of 1997. Perhaps more and bigger fish and much need precipitation this winter from the west coast.
What does this mean to you, the angler? Extreme warm water currents have swung into the California coast bringing an early abundance of the migratory tuna and warm water species not normally found so close to our fishing grounds.
Normally, we find Yellow Tail in the early spring months late March and April, followed by the Albacore, which are now just sticking their noses up 80-100 miles out, in May, June and July maybe hanging around until September, followed in July by the Blue Fin, then Yellow Fin and the Big Eyes and Dorado latter in the season.
One thing that does bother at this point is a few Skip Jack have been caught which generally signals the tuna are getting ready bail, right now it's a wait and see, but I'm optimistic the fish will hold. This year, experts say the Yellow Tail never really migrated out, the anglers quit coming and the boats quit running.
Yellow Tail didn't migrate out as the season cooled off last year. February 2015 on exploratory trips, Yellow Tail where caught early on the 302 on Rock Pile, and it's been good numbers and quality on them all year. Instead of Albacore, we have Blue and Yellow Fin in abundance early in the 2015 season.
Blue Marlin have been caught close in, off shore, in recent days and reports of Wahoo caught within the 120 mile mark. Usually the Wahoo hang around Alijos Rocks 480+- miles, (from H&M Landing) 160+- mile off the Baja coast.
On a recent 34 day trip on the Malihini our first Blue Fin stop was on the 9 Mile Bank. We chased Blue and Yellow Fin tuna all day, never lost sight of the coast.
Unbelievable! Check the daily fish counts on the Malihini, I'm not kidding, fishing is hot. They're catching Dorado; try that on your grill!
With any luck, the Albacore will continue to bite, hang with the other tasty species and extend the season well in to late October and perhaps November. It's a good bet, thinking about booking a trip, do it! hmlanding.com.
Did I mention anglers are boating Opah? AKA "Moon Fish" a highly prized novelty game fish.
The rest of the good news is wetter winter months dropping much need precipitation in Arizona to mitigate the lower water levels we have been experiencing with the seven year drought that's lasted for twelve years.
Roosevelt Lake's been hovering around the low 40% full mark, we need water.
Below is the scientific scoop from the National Oceanic and Atmospheric Administration.
NOAA: Major El Niño Still on Track
Source: Weather Underground, Bob Henson, 5:12 PM GMT on August 13, 2015
In its latest monthly outlook, issued on Thursday (see PDF), NOAA continues to project that the ongoing El Niño event, already close to record strength for August, will at least approach the highest overall strength observed at any time of year since 1950. As of last week (see PDF), sea-surface temperatures across a key part of the eastern tropical Pacific called Niño3.4 were running 1.9°C above the long-term average for this time of year.
This month's Niño3.4 values could end up warmer than those for any other August in the official NOAA database, which goes back to 1950. The most recent value of NOAA's closely watched Oceanic Niño Index, which is based on three-month averages for Niño3.4, was +1.0°C for May-July 2015, which ranks behind only 1987 (+1.1°C) for May-July readings.
The NOAA outlook released on Thursday notes that the atmosphere-ocean coupling remains strong across the tropical Pacific, with weaker-than-average trade winds. Also, showers and thunderstorms have shifted toward the central and eastern equatorial Pacific from the west. "Collectively, these atmospheric and oceanic features reflect a significant and strengthening El Niño," noted the outlook.
Figure 1. Early-August status of the 1997 and 2015 El Niño events in terms of satellite-derived data showing departure from average sea-surface height for a given time of year, which is correlated with warmth in the upper ocean. This animation shows the side-by-side evolution of both events.
More signs of a barn-burner El Niño can be gleaned from the international array of computer models scrutinized by the Australian Bureau of Meteorology. Each month BOM calculates a multimodel average of Niño3.4 values going out for several months. In July, BOM's multimodel average indicated that the Niño3.4 anomaly (departure from the seasonal norm) will rise to around +2.6°C by October and +2.7°C by December.
This would imply a three-month average (Oct-Dec) of between +2.6° and +2.7°C. Were this to materialize, it would be well above the previous record three-month average in the NOAA database of +2.3°C, observed in Sep-Nov and Oct-Dec 1997.
The multimodel average soon to be released from August runs could end up a bit tamer than the value for July, given that several models have pulled back somewhat on their forecasts. NOAA's Climate Forecast System (CFSv2), which was calling in July for a peak Niño3.4 anomaly of close to +3.0°C by late in the year, is projecting a value closer to +2.0°C in its most recent run (August 10).
Figure 2. NOAA's Climate Forecast System model (CFSv2) continues to show El Niño intensifying into this autumn, then decreasing in early 2016, in a fairly typical pattern for a strong El Niño event. Niño3.4 sea-surface temperatures are projected by CFSv2 to rise to about 2.0°C above the seasonal norm. The panels at right show SSTs for three-month windows from Aug-Oct 2015 (top left) to Feb-Apr 2016 (lower right).
There are well-known limits to how well models can simulate El Niño, and even a solid model can be temporarily "fooled" by short-term changes in the tropical Pacific. Nevertheless, the general consistency in El Niño outlooks across models and across time--and the steadily building warmth across the eastern tropical Pacific, both at and below the surface--suggests that an event as strong or stronger than any observed in modern times is still a real possibility.
That said, NOAA forecasters stressed in a Thursday morning news conference that El Niño is not guaranteed to bring drought relief to California. In the crucial water-storage region of the central Sierra, for examples, the last four years brought only 56% of the cumulative average precipitation from October 2011 through July 2015, leaving a 71-inch deficit. To make this up, the region would need roughly 2.5 to 3 times its annual average precipitation over the coming year, said Kevin Werner, director of climate services for the National Weather Service's Western Region. "We'd need something in excess of the wettest year on record to balance the four-year deficit," Werner said.
This message was reinforced by Mike Halpert, deputy director of NOAA's Climate Prediction Center. "Just because something is favored, it doesn't guarantee it will happen. One season of above-normal rain and snow is very unlikely to erase four years of drought," said Halpert.
For more background on what impacts we might expect from El Niño over the next few months, see our North American roundup post from July 28 and our special post on potential Northeast U.S. impacts. Jeff Masters will take a look at global impacts of El Niño in a forthcoming post.
What happened to the El Niño of 2014-15?
If you thought we were already in an El Niño episode a few months ago, you might be puzzled to see that the official NOAA database no longer shows it. This change is due to a fairly minor update in the ocean temperature record that pulled one key period just below the required threshold.
Figure 3. Departures from seasonal average for sea-surface temperatures (SSTs) across the Niño3.4 region over three-month intervals from 1997 to 2015. The shaded box (Jan-Mar 2015), originally 0.5°C, was "demoted" to 0.4°C with a July upgrade to SST analysis techniques.
To qualify as a full-fledged El Niño episode, the Niño3.4 departure must be sustained at +0.5°C or greater for at least five overlapping three-month-long periods. When NOAA analysts are tracking El Niño in real time, they rely on a series of daily and weekly analyses of sea-surface temperature called OISST (optimum interpolation SST). OISST incorporates data from a variety of sources, including satellite-based measurements that are useful for short-term needs but which can introduce biases if they're folded into a longer-term dataset that predates a particular satellite.
For those longer-term purposes, the NOAA National Centers for Environmental Information (NCEI, formerly NCDC) produces the Extended Reconstructed Sea Surface Temperature (ERSST), a monthly dataset that goes back to 1854 and that uses statistical techniques to fill in data gaps.
Every few years, the techniques used in ERSST are updated and a new version of the full dataset is released. This occurred with the advent of ERSSTv4 this past July. As it happens, ERSSTv4 brought down the Niño3.4 anomaly for January through March 2015 from +0.5°C to +0.4°C (see Figure 3).
Even though every other three-month window since Oct-Dec 2014 is still at +0.5°C or greater, this "demotion" of Jan-Mar 2015 means that we have yet to see five consecutive three-month periods of El Niño. Without those five periods, we haven't yet met the formal definition for an El Niño episode (shown as red intervals in the NOAA historical database and in Figure 3 above).
By next month, though, we'll have five consecutive periods, and the El Niño episode will again become official, extending back to Feb-Apr 2015. The ERSSTv4 introduction also downgraded a few other El Niño and La Niña events from the last 65 years. These are identified by Jan Null (Golden Gate Weather Services) on a website that classifies El Niño and La Niña events by strength.
One more wrinkle: it's possible that Jan-Mar 2015 could be "undemoted" next year, when the climatology that underlies the above- and below-normal categorizations goes through a scheduled five-year update that takes long-term warming into account. In any case, the atmospheric response to the warm Niño3.4 readings in the winter of 2014-15 fell short of the usual El Niño standards, according to Michelle L'Heureux (NOAA Climate Prediction Center), so it's best not to place too much emphasis on this borderline event.
The Case of the Not-Quite El Niño Episode reminds us of an important point stressed by L'Heureux: "Our SST observations are estimates. This is why we always encourage looking at multiple indices and datasets when trying to assess the state of ENSO. No one dataset or index will ever be perfect."
The further back in time we go, the more piecemeal is our knowledge of the SSTs that prevailed at the time. This is why NOAA's most commonly used database of ENSO episodes only extends back to 1950. It's quite possible to use ERSSTv4 or analyses from other research centers to calculate Niño3.4 values prior to 1950. However, these must be used with caution, as the data become increasingly scant going back in time (see Figure 4 below). To help flesh out the picture, scientists look to independent measurements related to El Niño, such as the Southern Oscillation Index, based on the observed difference in barometeric pressure between Darwin, Australia, and Tahiti.
The greatest confidence in pre-1950 ENSO history is for the very strongest events, which are typically reflected in a wide range of land-based repercussions consistent with El Niño and La Niña behavior. For example, the El Niño of 1877-78 appears to have been at least as strong as the "super" 1982-83 and 1997-98 events.
Calculations based on ERSSTv4 by wunderground member Eric Webb (@webberweather) suggest that the Niño3.4 value topped 2.5°C for several months. Drought associated with the 1877-78 El Niño may have contributed to horrific multiyear famines that took an estimated 5 million lives in India and 9-13 million lives in China.

Did I mention anglers are boating Opah? AKA "Moon Fish" a highly prized novelty game fish.
For an update on the latest tropical cyclone action, including a fizzling Tropical Storm Hilda and twin typhoons predicted to develop next week, see this morning's post by Jeff Masters at http://www.wunderground.com/blog/JeffMasters/comment.html?entrynum=3070. - Bob Henson
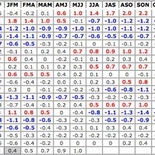
Figure 4. Distribution of sea surface temperature observations from the International Comprehensive Ocean Atmosphere Data Set for each 20-year period from 1860 to 1979. This dataset underpins the NOAA ERRST long-term reanalysis discussed above. Color shading indicates the percentage of months that have at least one measurement within a 2°-latitude by 2°-longitude grid box (roughly 140 by 140 miles near the equator). Image credit: Used with permission from "Sea Surface Temperature Variability: Patterns and Mechanisms," Annual Review of Marine Science 2009, doi: 10.1146/annurev-marine-120408-151453, courtesy Clara Deser, National Center for Atmospheric Research.


Reader Comments(0)